Pensions automatic enrolment has generally been a success, but there have been drawbacks too, one which has grabbed headlines recently being the proliferation of small pots.
Different ways of resolving small pots have been discussed. Since the November 2023 Budget the front runner seems to be a pot-for-life model, drawing on the Australian workplace pension experience and their superannuation schemes.
There are similarities between the UK and Australian systems – automatic enrolment of employees, minimum employer and employee contributions, unit-linked defined contribution arrangements without guarantees, and both have focused on accumulation but are now grappling with how to best convert accumulated funds into a retirement income.
But there are key differences too. Australia already operates a pot-for-life model where workers choose their own Super and keep this as they move from job-to-job; unlike the UK where the employer chooses the scheme. The Australian model is more mature and has higher contributions and average funds. And with those larger funds and the pot-for-life model, Supers have invested more heavily in illiquid assets than UK schemes.
Regulation across the two regimes is also different, with Supers must publish historical data on charges and investment performance and underperforming Supers required to take corrective action or close to new savers.
So how do Australian Supers compare to UK Workplace schemes? Let us take a first look at comparing the two systems through the lens of one of the key drivers for member outcomes: the investment returns for younger workers. The headline measure of returns on Supers is currently a 9-year net of fees return, though shorter data, at 3 and 5 years, is also published. There is no regulatory requirement for UK providers to publish similar returns, but Corporate Adviser publish voluntary returns data in its CAPA (Corporate Adviser Pension Average) index.
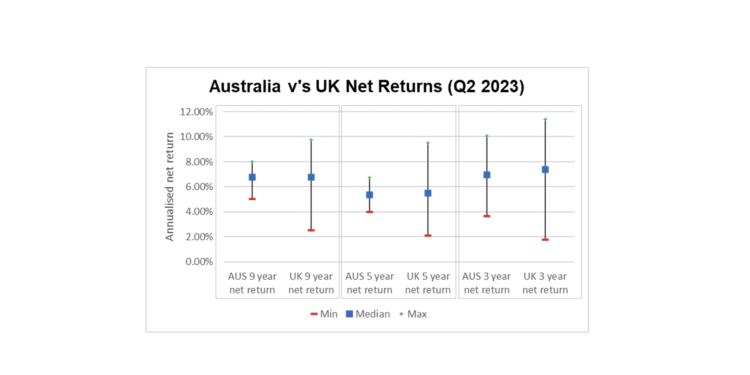
The CAPA index is not universally populated at a 9-year period, the number of UK schemes reporting across that period is small with more data available at shorter periods. And CAPA does not have a net of fees measurement, but in the graph below I have used 0.5 per cent average annual charge for the UK schemes to draw comparisons.
Looking at the full set of returns across 9, 5, and 3 years comparing the Australian Super data to the CAPA data (for someone 30 years to retirement) for UK providers gives an interesting picture:
The average performance is similar across both countries, but the spread of returns in the UK is wider than Australia. Is this caused by the benchmarking of returns and the Australian focus on under-performing funds? Do Supers need to be “in the pack” rather than trying to lead it? And is that something the UK should emulate? There are no easy answers here, but they seem like good questions to ask.
There are some flaws in the UK system where we can learn from Australia such as a lack of investment in illiquid assets and fragmentation of small pots. But some providers still consistently outperform all their Super counterparts.
Whilst the UK can learn from Australia, both from the positive aspects and some of the lessons learned by their system over the years, we should not lose what is good in our own system and try to avoid the “race to the middle” through the wonderful driving force of competition we have in our market.
Taking a step back, this investment comparison is only a part of the bigger picture. Both regimes want to provide members with the best outcome possible. A focus on VFM and comparing across providers can help to improve both the assessment of VFM and the actual VFM offered. At WTW we have been involved in and continue to develop more holistic views of VFM to include more qualitative and quantitative factors to assess and benchmark VFM. This will be a crucial focus in the future from regulators, independent bodies, and the providers of workplace pensions.


